Gold, Silver, and Palladium Commentary
June 24, 2020
The ratio of the 1-month Gold contract to the 1-month Silver contract (Figure 1) continued to rise this week. With the front month silver and gold contracts closing yesterday at $18.05 and $1,772.10, respectively, the gold/silver ratio is now 98.172, down 22% from its all-time high set on 3/18/2020 but rising from its recent low on 6/16/2020. August Gold (Figure 2) moved to the top of the trading range listed for last week while September silver (Figure 3) is up 2% since last week’s commentary. While silver appears to be settling back into a trading range between 16.5 and 19, the open interest continues to grow back toward values prior to COVID. Silver open interest is currently about 17% below pre-COVID values, despite growing 4% in the last week.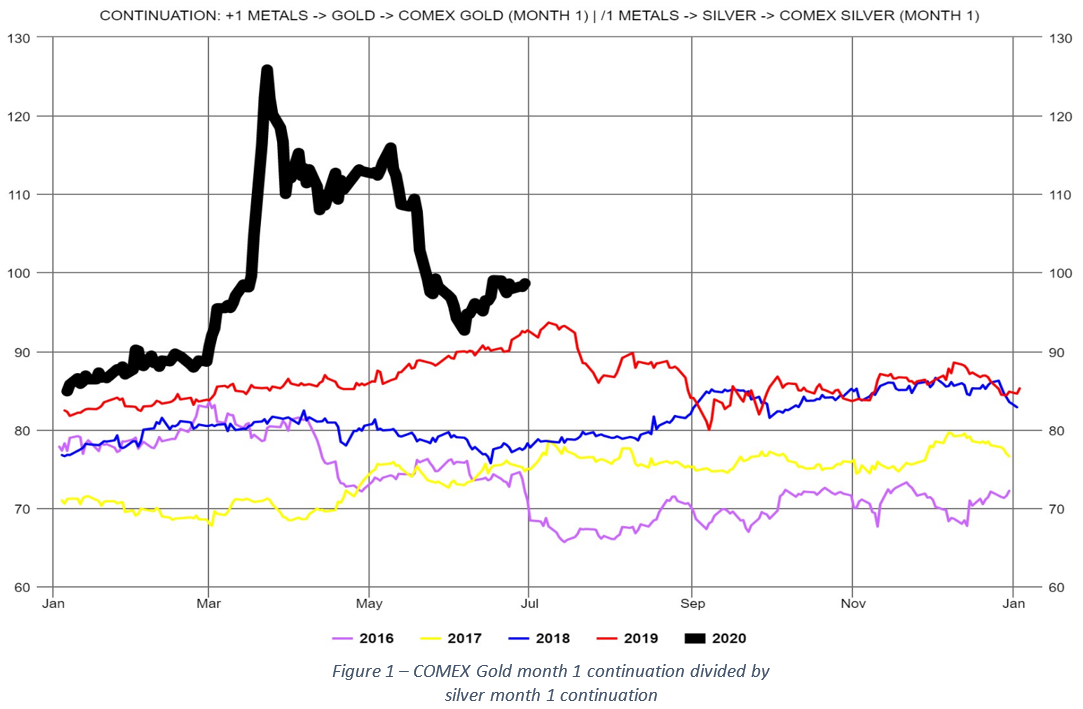
On 6/23/2020 the August COMEX gold contract (Figure 2) ended the day at $1,782, up from $1,736.5 at the close on 6/16/2020. Open interest has continued to climb during the same time and is up 11% since its low for 2020 on 6/8/2020.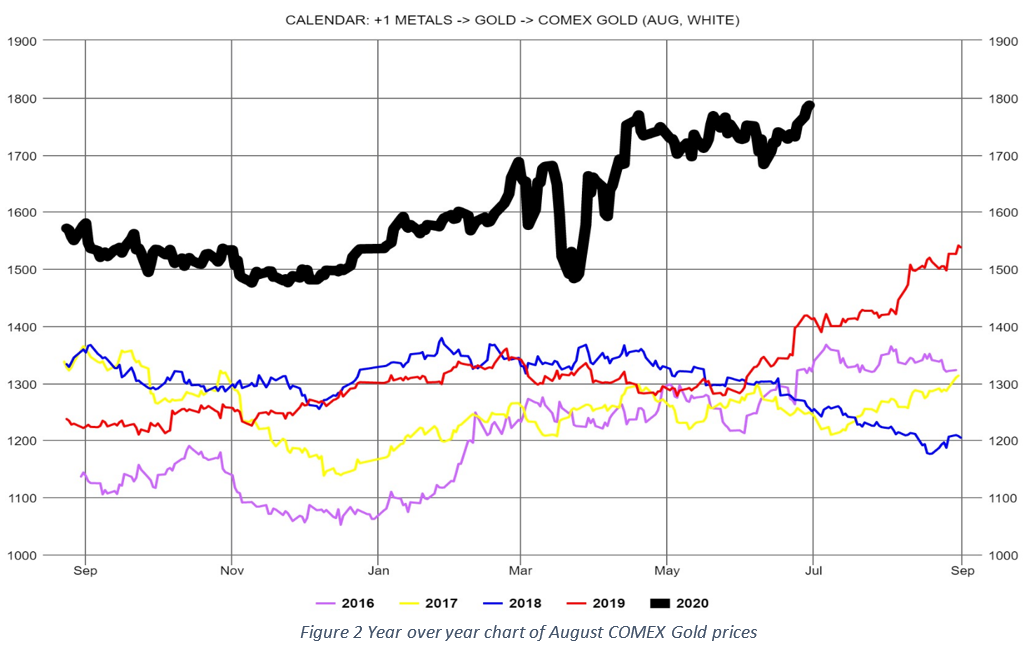
As we have mentioned over the last several weeks, there is a good case for an increase in the price of gold due to demand for safe-havens due to COVID and other geopolitical issues. While gold is pushing to the top of its recent trading range, we expect gold will continue to trade in the range between $1,718 and $1,806 for the next 7 days.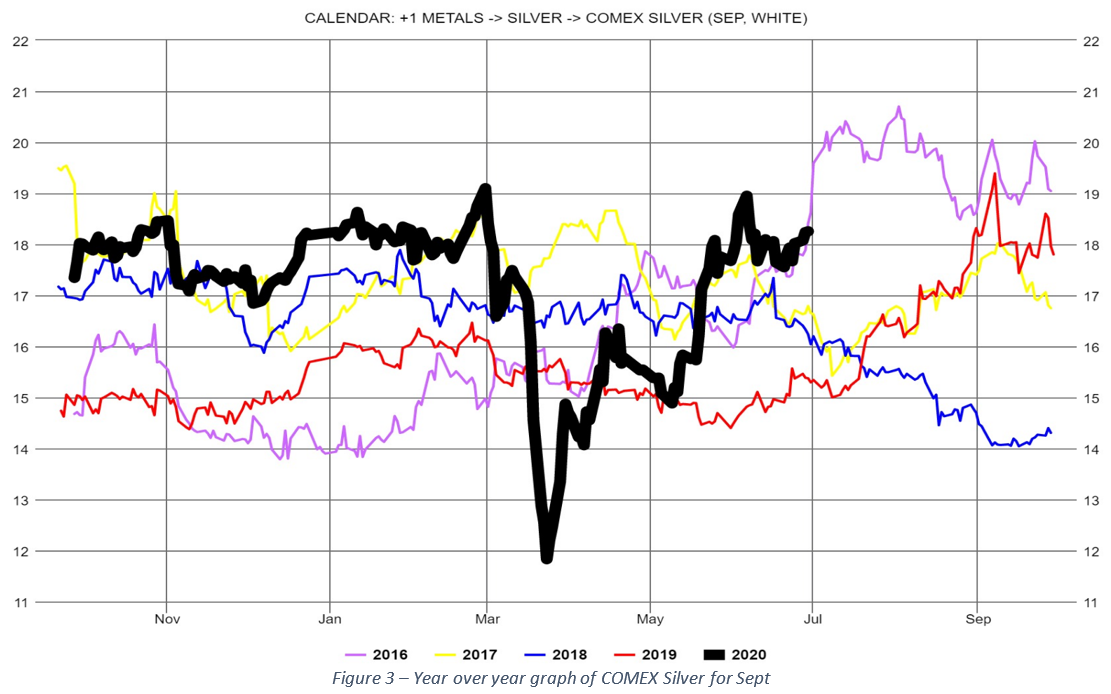
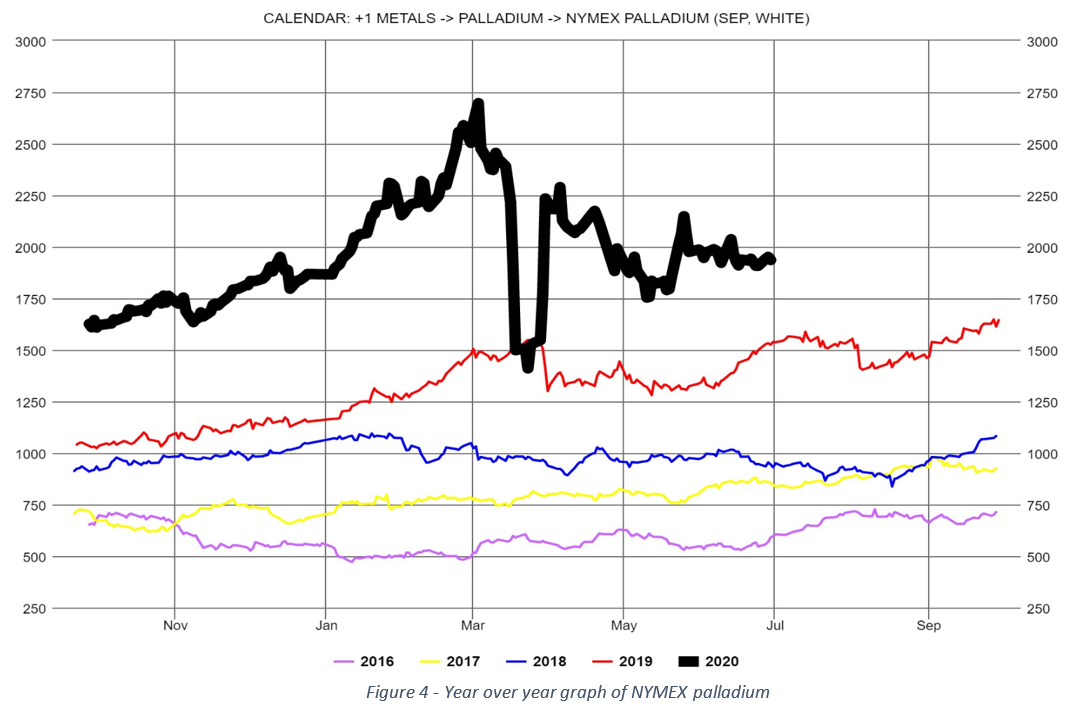
Palladium remains unchanged since last week while open interest increased slowly – about 1% per day. We will continue to watch to see if this trend continues to see if there may be early signs of a directional move. Without a clear signal of increasing open interest or news on increased production demand, we expect palladium to continue to trade in a similar pattern for the near future.
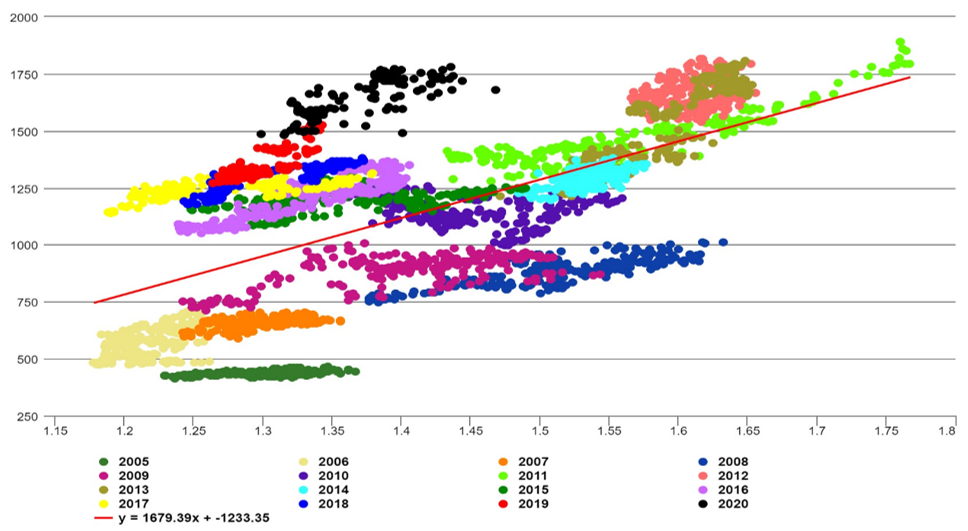
Finally, I leave you with an interesting graph to consider. The graph plots the price of gold with respect to 10-year interest rate divided by the US dollar index, grouped by year. I created this chart after reading a short paper on valuing gold by Charlie Morris. You can read the paper by clicking here if interested. You can see from the graph that while 2020 is tending to follow the overall trend, the 2020 gold price is elevated with respect to historical predictions.
If you would like access to the great insights and analysis provided by the Fundamental Analytics platform, sign up for a 15-day free trial and demonstration!
If you have any questions, please contact our Technology Manager, Mike Secen at [email protected]
We also invite you to read our other articles and follow us on social media!
Best Regards,
The Fundamental Analytics Team
The information provided here is for general informational purposes only and should not be considered individualized investment advice. All expressions of opinion are subject to change without notice in reaction to shifting market conditions.