Energía
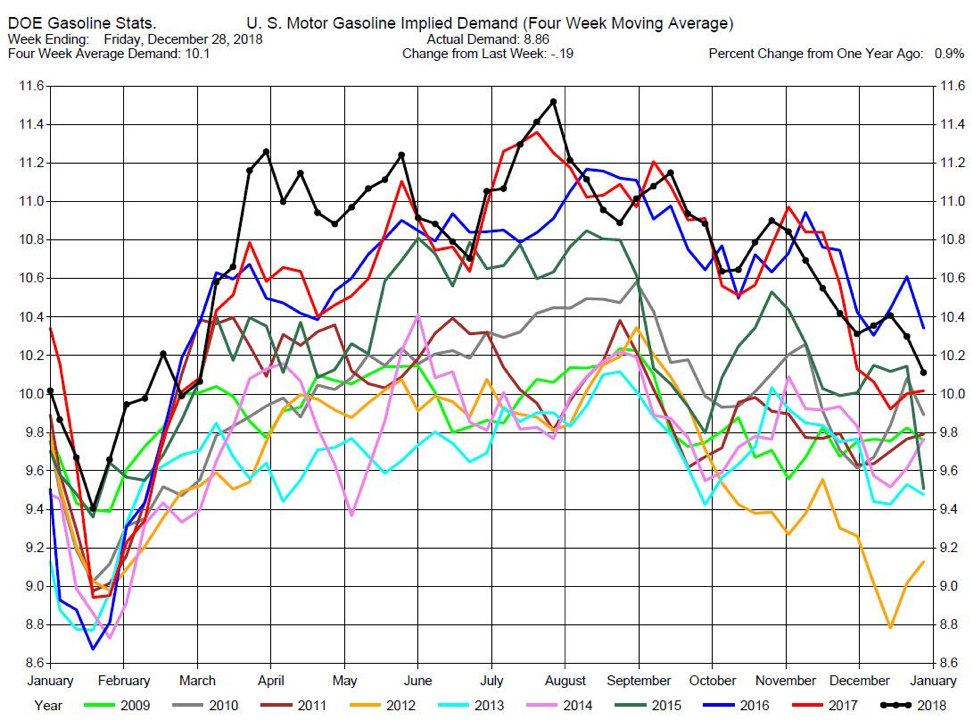
January is the start of refineries turnaround, when parts of the refineries are shut down for maintenance and preparation for the summer driving season. As shown by Chart 1, there is a drop in Crude Runs in the refineries through January and into February. Correspondingly, there is a drop in the production of gasoline during this period (Chart 2) as demand for gasoline is lower in January (Chart 3). The lower demand can pressure prices in both the refined products and crude oil.
Chart 1
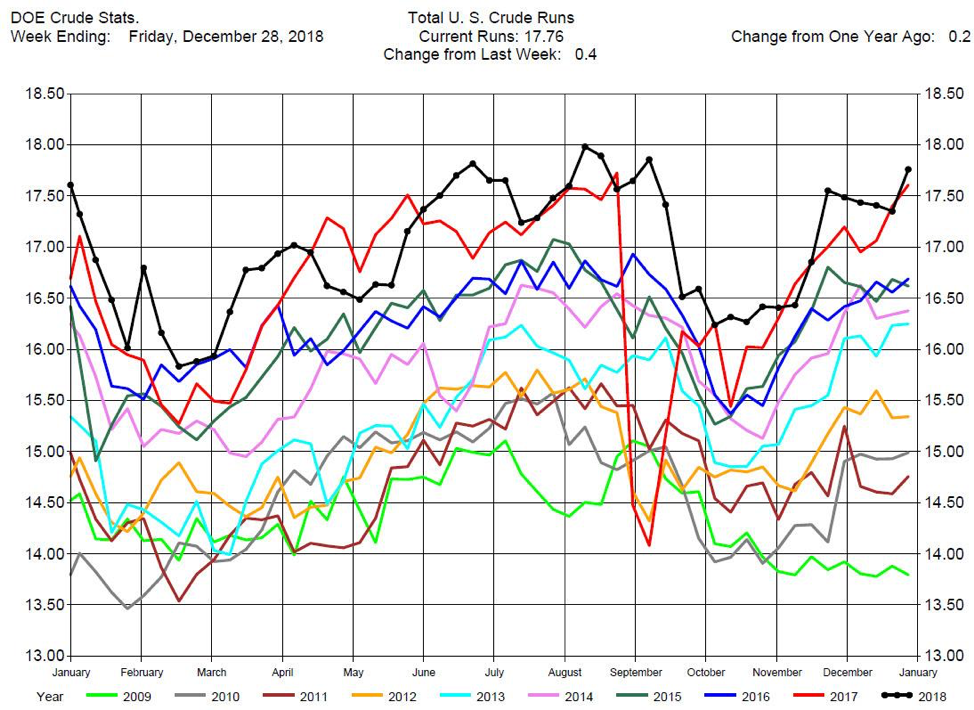
Chart 2
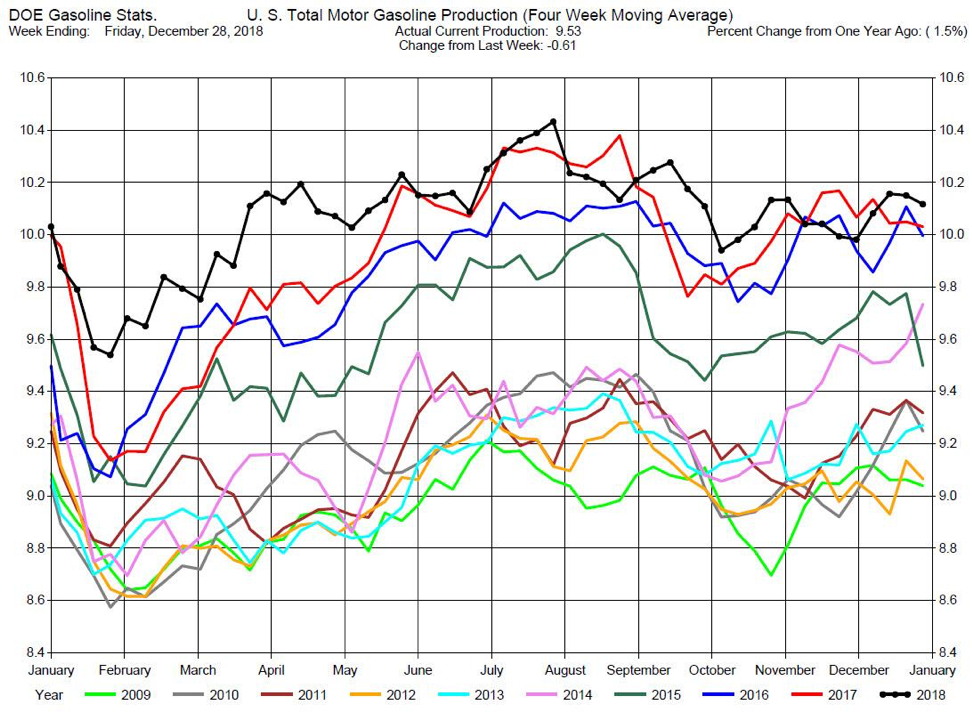
Chart 3
Grains
Corn is the raw material in the production of biofuel ethanol in the US. About 40% of the US corn crop is used in the production of ethanol. Corn prices rebounded from their lows last September, but ethanol prices have continued to weaken (Chart 4).
In fact, ethanol prices in equivalent bushel prices (1 bushel of corn produces 2.8 gallons of ethanol) are lower than corn prices. Chart 5 plots corn prices (black line) and equivalent ethanol prices (red line). When the black corn line is above the red ethanol line the spread, or margin, is negative.
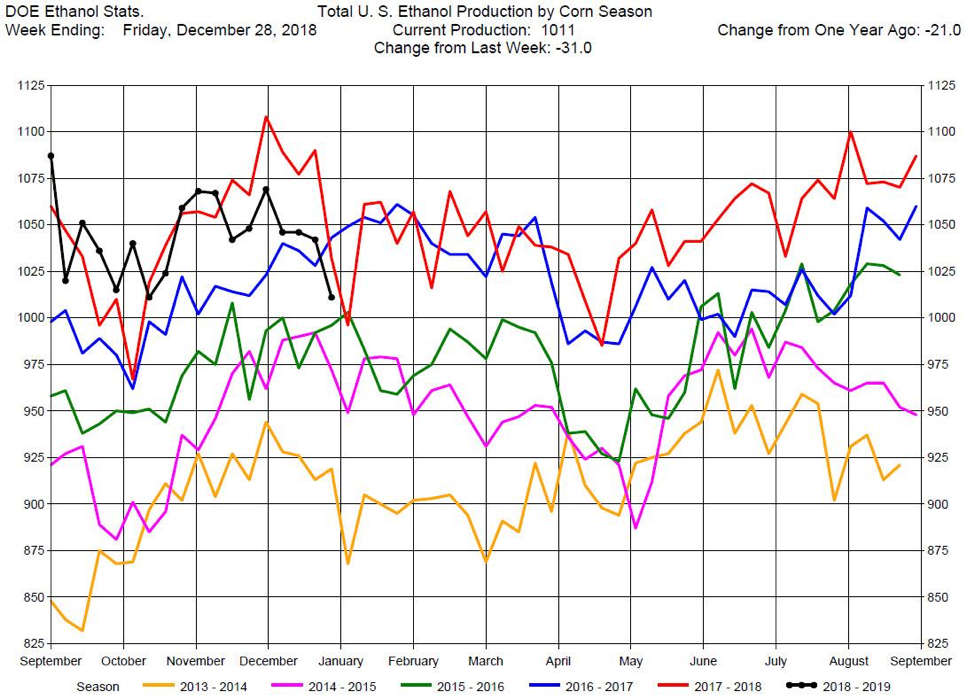
Chart 6 is a year-on-year overlay of the spread between ethanol and corn. The black line, the 2019 spread, is at record lows around -20 cents. Ethanol refiners are currently running at a loss. Ethanol inventories are at record high levels for this time of the year, so supply is plentiful (Chart 7). Consequently, ethanol refiners have been cutting production (Chart 8, black line). For the week ending December 28, ethanol production dropped by 31,000 barrels per day.
Chart 4
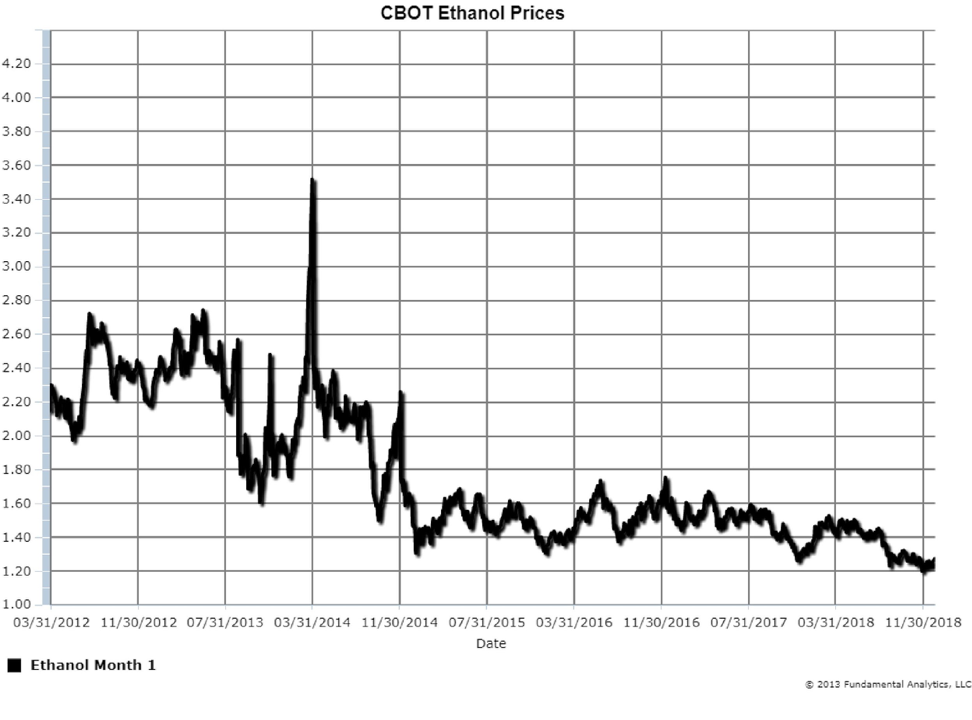
Chart 5
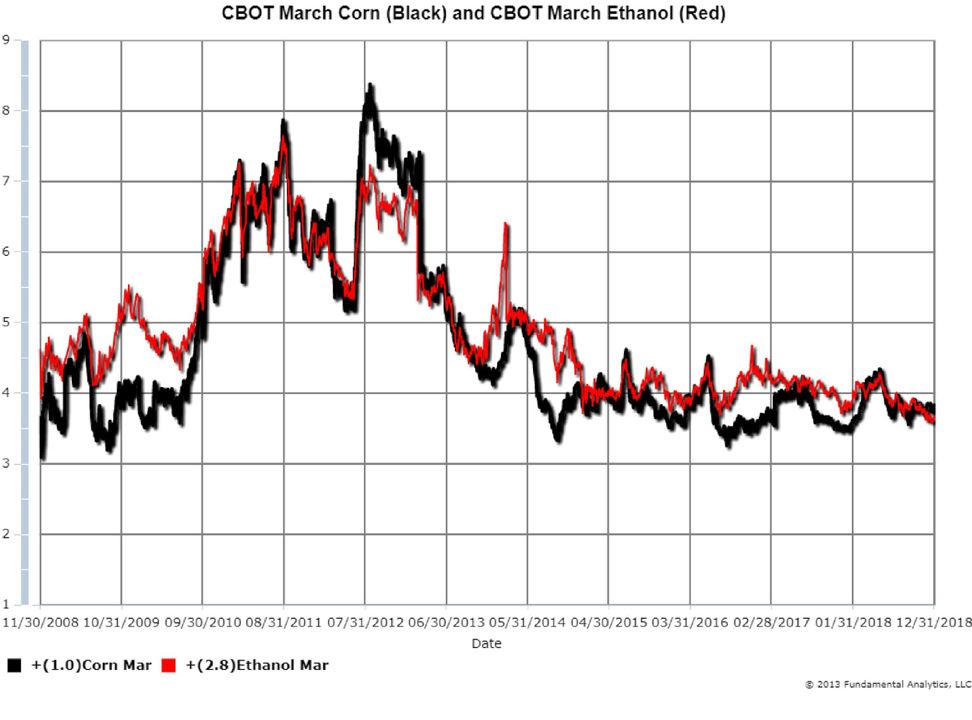
Chart 6
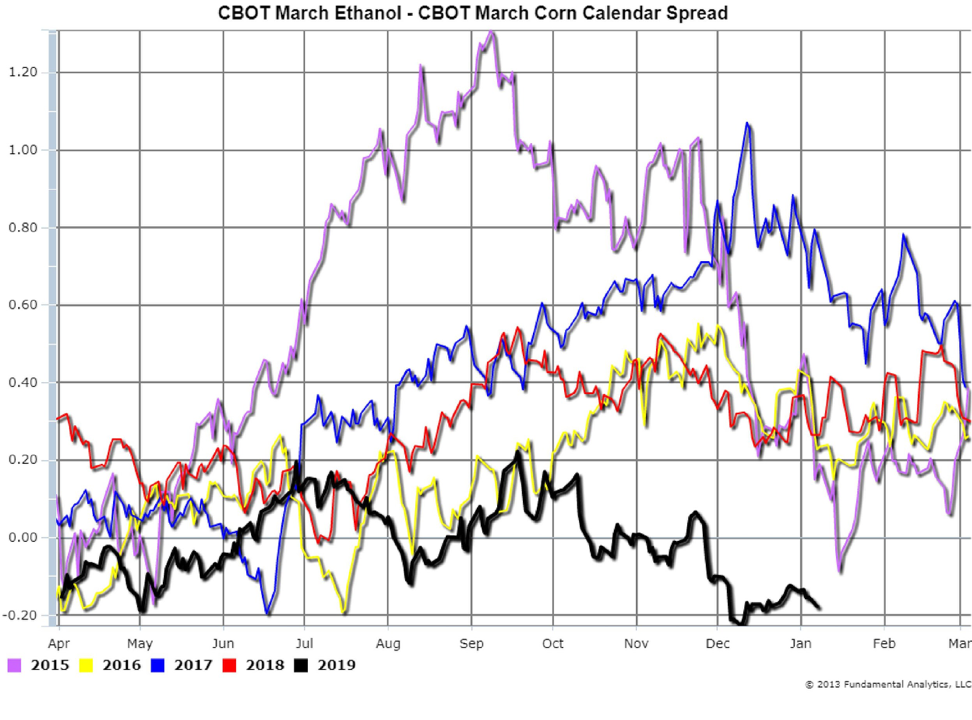
Chart 7
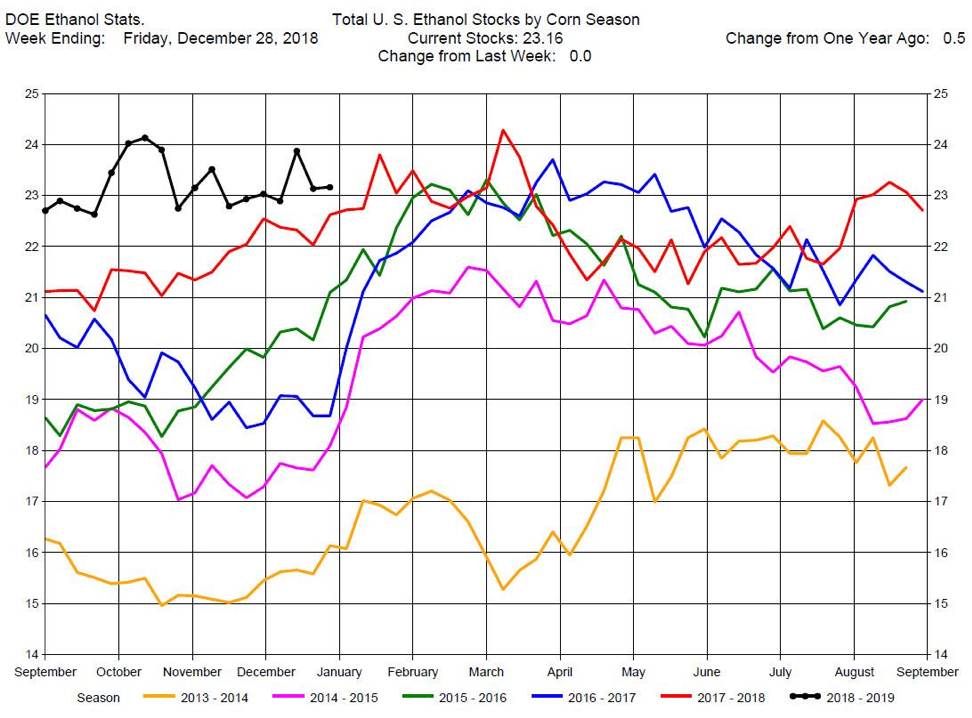
Chart 8
