Commodity Market Update August 7, 2018
Energía
Injections of Natural Gas in Storage (measured in billion cubic feet, Bcf) for use during the Winter Heating Season start around the beginning of April each year. The Injection Summer Season lasts for about the seven months of April through October. Natural Gas in Storage is then withdrawn from Storage during the Winter Withdrawal Season, which lasts for about the five months of November through March.
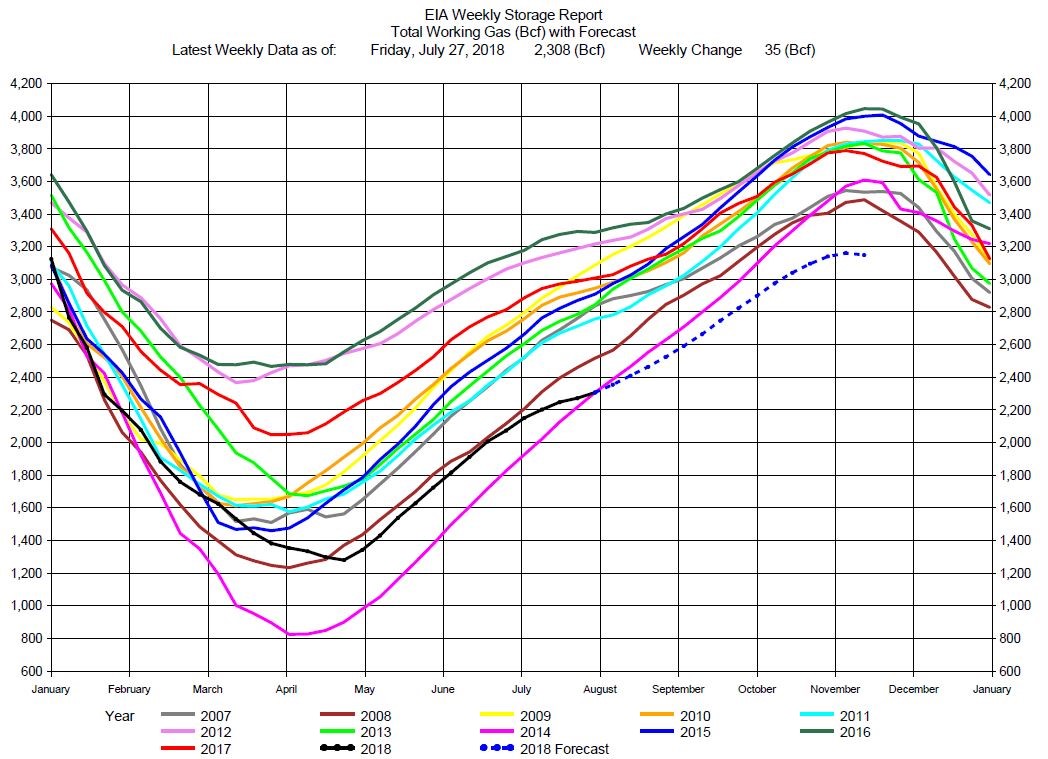
Chart 1 is a Year-on-Year plot of the Storage Injection/Withdrawal cycle. For the week ending Friday, July 27, 2018, the amount in Storage is 2,308 Bcf (black line), a record low for this week of the year. The chart includes a computer model forecast (blue dashed line) estimating Storage at the end of the Injection Season to be close to 3,200 Bcf. 3,200 Bcf in Storage in November would be at a record low to begin the Winter Heating Season. And that means the potential for a record low Storage at the end of the Winter Heating Season next April.
Chart 1

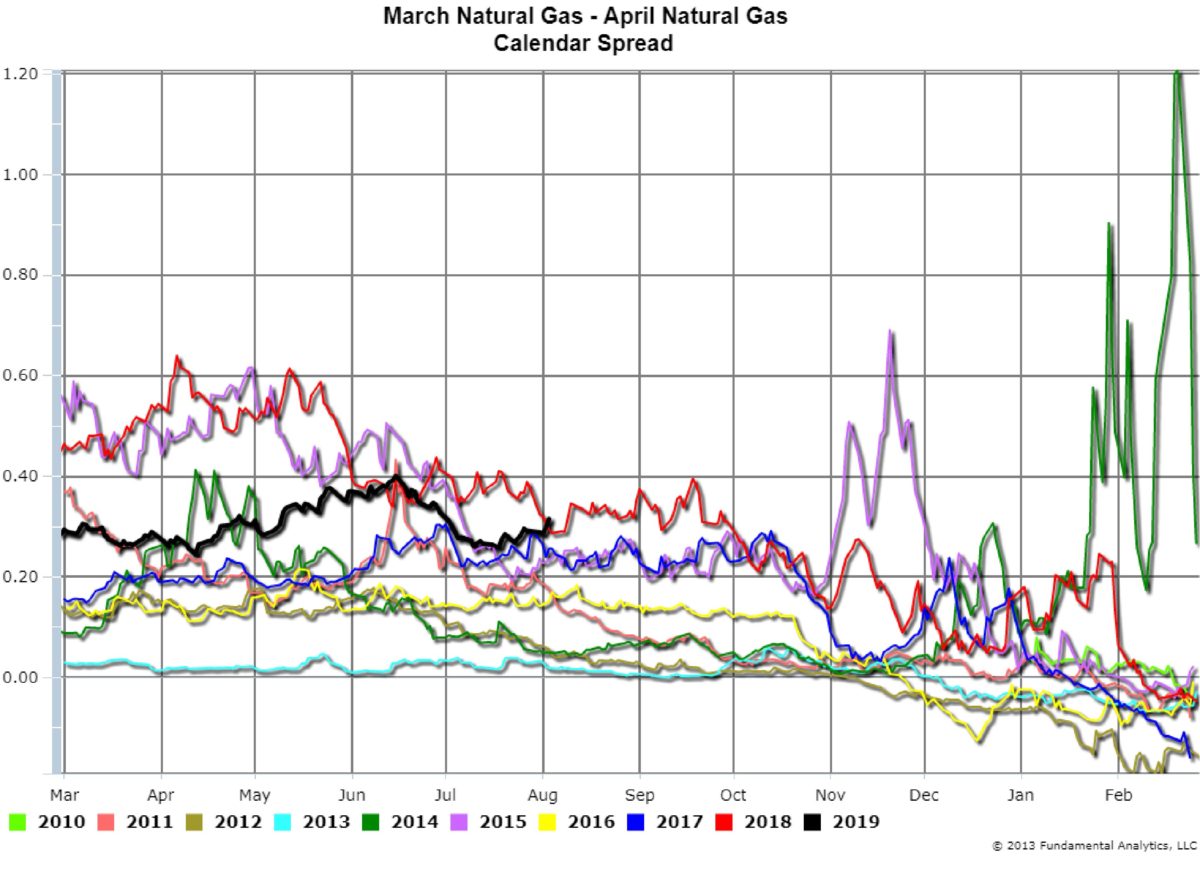
Storage levels are reflected by a Natural Gas Calendar Spread of prices, the March Natural Gas Contract – April Natural Gas Contract (Chart 2). The current March-April Spread (black line) is a trade indicating where traders believe Storage levels will be next spring.
The spread will end up being negative (very low) if the Storage level is very high at the end of the Winter Season. This was the case, for example, in the Spring of 2017 when there was over 2,000 Bcf in Storage (Chart 1, red line). The corresponding March-April Calendar spread expired very low (Chart 2, blue line). A trader would be short the spread in this case.
In contrast, the spread will “blow out” if Storage at the end of the Winter Season is very low. This was the case, for example, in the Spring of 2014 when there was only 800 Bcf in Storage (Chart 1, violet line). The corresponding March-April Calendar Spread (Chart 2, green line) traded to record highs. A trader would be long the spread in this case.
Currently the March-April Spread is relatively high, corresponding to the current Storage level being seasonally low, with the potential of being very low next Spring. A trader would want to be long the March-April Calendar Spread.
Chart 2
 Grains
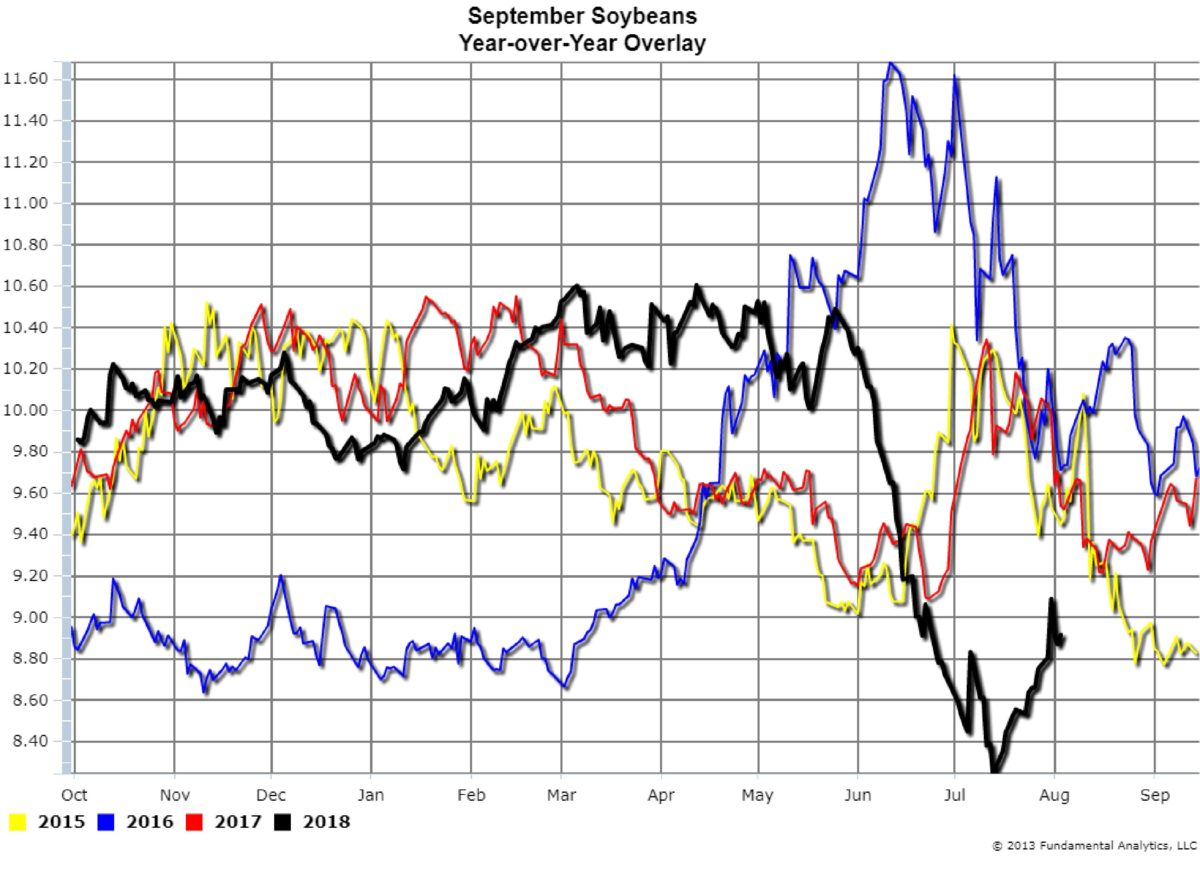
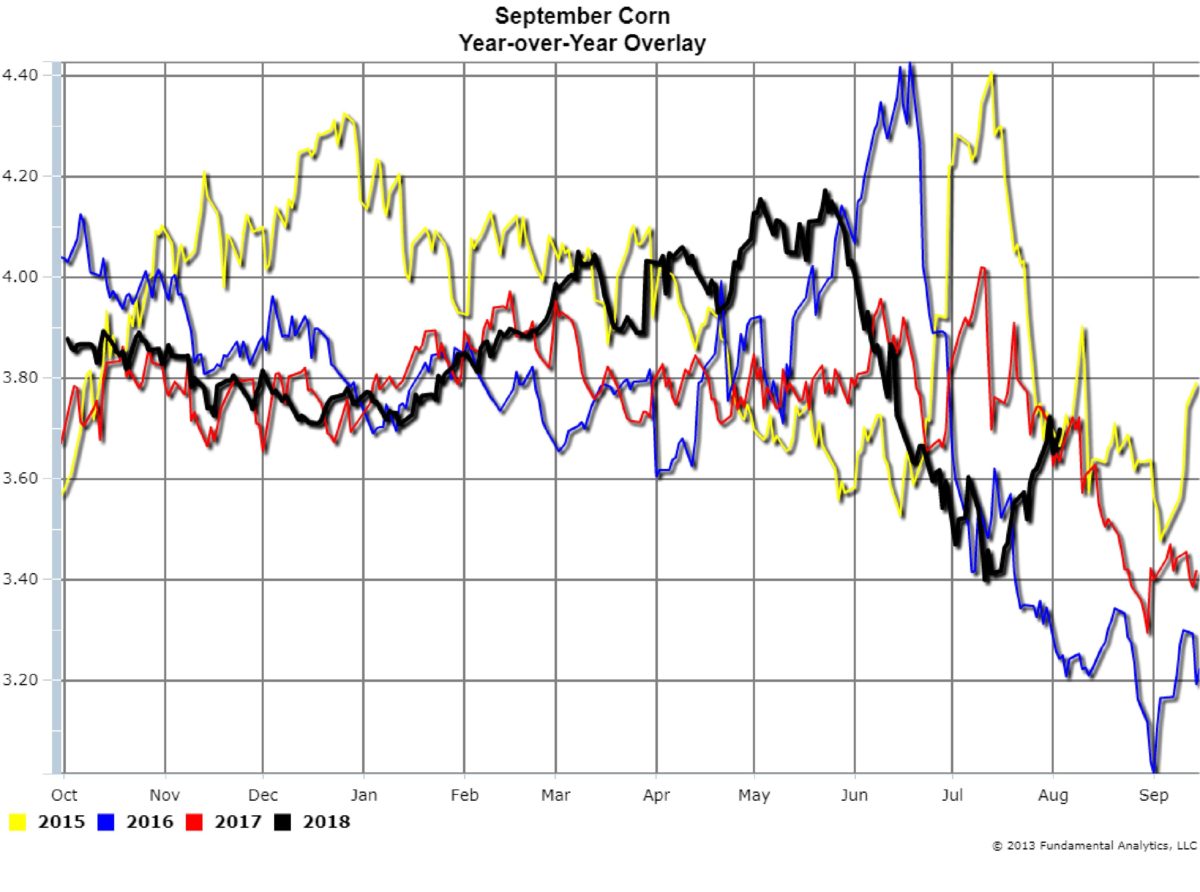
For the week ending August 3, 2018, soybeans and corn prices were higher. This marks the third consecutive week of price increases (see Charts 3 and 4, black lines), after the nearly eight-week decline in prices starting in late June. The continued dry weather in the Midwest has contributed to the rising prices as well as reports of hot, dry weather in Europe hurting corn production.
However, the news that the Trump administration is ready to increase tariffs on $250 million Chinese imports to about 25% is pressuring prices, especially for soybeans. And traders are waiting for the latest monthly USDA report this Friday. Analysts expect that corn and soybeans yield forecasts reported by the USDA will be strong if not record yields, adding more downward pressure on prices. Consequently, the soybean and corn price increases may be only temporary. So we suggest traders remain on the sidelines until more information and data become available this week.
Chart 3

Chart 4

Follow us on Twitter @fundanalytics or on LinkedIn