Dr. Ken Rietz
August 2, 2023
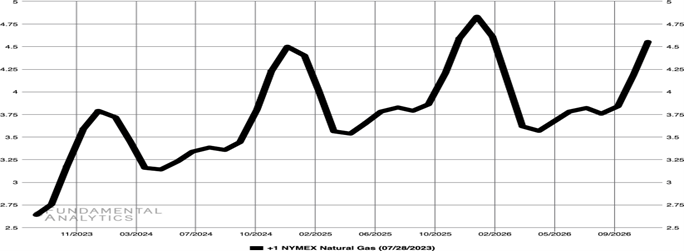
The chart of natural gas futures is extremely important for a few people, such as those who deal with buying and selling natural gas. The chart will tell them when to top off their storage, for example. But there is more here than meets the eye. The people who determine those numbers are not random. There is a lot of money at stake, and only the very best predictors survive. Let’s see what the experts say. To start, Figure 1 is the chart of natural gas futures.
Figure 1 – Price of monthly futures of Henry Hub natural gas, in USD per million Btu, from 29 August, 2023 to 25 November, 2026, as of 28 July, 2023

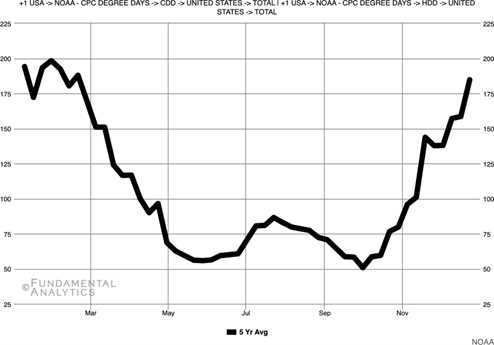
The immediate impression is that there is a distinct pattern of natural gas usage each year, which makes sense. Figure 2 (below) is the 5-year average of the sum of heating degree days (HDD) and cooling degree days (CDD) per week in the United States.
Figure 2: The 5-year average of the sum of the number of US Heating Degree Days and Cooling Degree Days each week (Source: NOAA)

Looking at the two together helps make sense of the variations in natural gas usage. There is a considerable increase in natural gas usage in the winter, for obvious reasons, but a much smaller increase in natural gas usage in the summer. That is because the increase in natural gas usage in summer is for electricity generation for air conditioners, while the natural gas usage in the winter is both for electricity and direct heating.
But that is all trivial. There is more to be seen. Specifically, what do these price projections say about the cost of natural gas in the future, and using natural gas as a proxy, what does it say about future inflation? If you run the numbers, the cost of natural gas in one year will be up 27%, hardly a prospect anyone would like. But the good news is that the price increment drops. The increase in natural gas for the entire year beginning one year from now is only 16%. And as you can see from the graph, in two years, the price changes will be almost zero, in fact slightly negative. That is, the futures curve indicates that inflation in natural gas should end in about two years. This also suggests that the demand for natural gas is not going to drop significantly in at least several years, since a large drop in demand would show up as a price drop. This means that the best minds estimate that green energy is not likely to take off in that time frame, either.
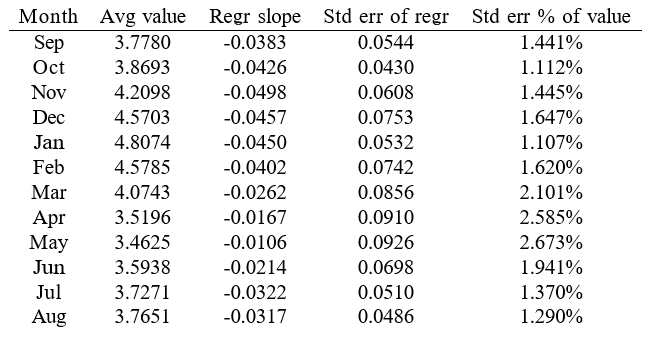
Using the data from Barchart.com for the natural gas futures from 2026 to 2031, the data continue to support this discussion. The following table (for the inspired statistician) gives the month-by-month analysis.
