Gold, Silver, and Palladium Commentary
July 22, 2020
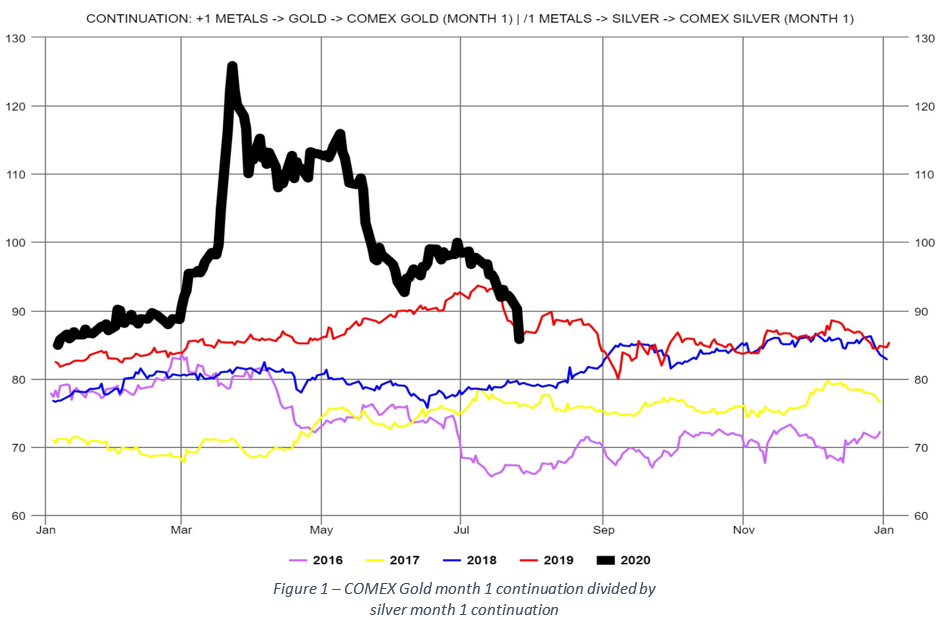
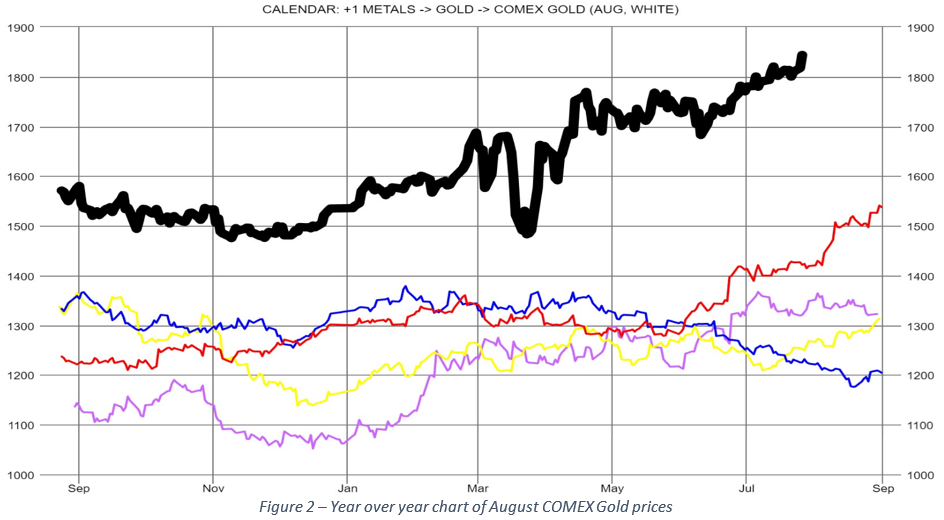
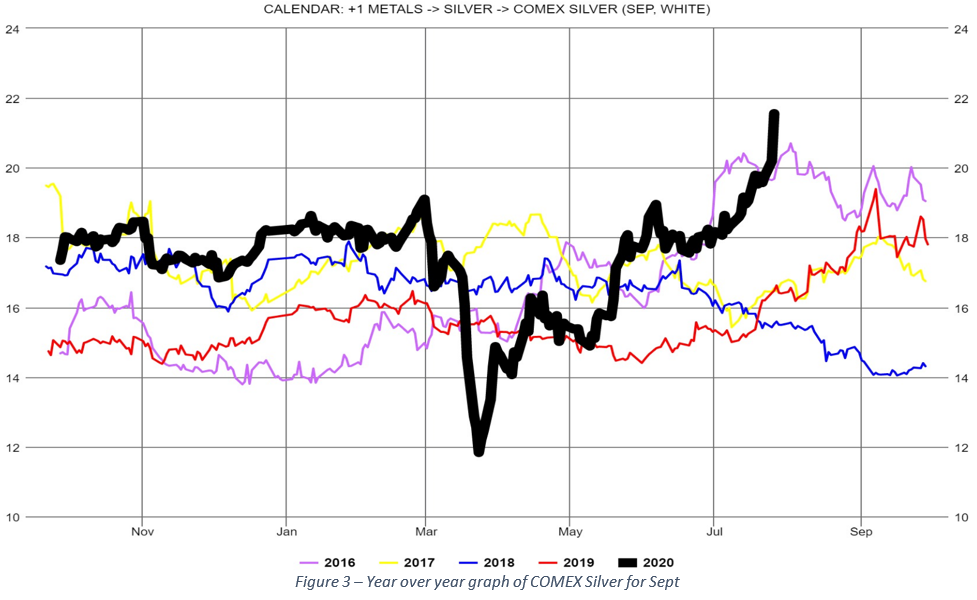
The ratio of the 1-month Gold contract to the 1-month Silver contract (Figure 1) continued the downward trending, falling a significant 8% this last week. Even with gold’s strong upward move, the fall was driven by silver’s even more aggressive upward move. With the front month silver and gold contracts closing yesterday at $21.497 and $1,842.40, respectively, the gold/silver ratio is now 85.71, or 12% higher than the 5-year average, having fallen from 20% last week. August Gold (Figure 2) closed yesterday at $1,843.90, up 1.7% since last week and September silver (Figure 3) moved up to $ 21.557 from $19.53 last week, up 10.4% since last week. Total open interest for both metals continue to increase along with increasing prices which tends to indicate increased long positions. But it is interesting that gold volume remains subdued compared to 2019 average volumes and the most recent COT report showed a slight decrease in gold non-commercial net long positions. Silver volumes are close to historic levels and the most recent COT report shows continued increase in non-commercial net long positions. The most recent “In Gold We Trust” report stated that a falling gold/silver ratio significantly increases the probability of a bull market in gold. This is the exact scenario we have seen for the last few months.
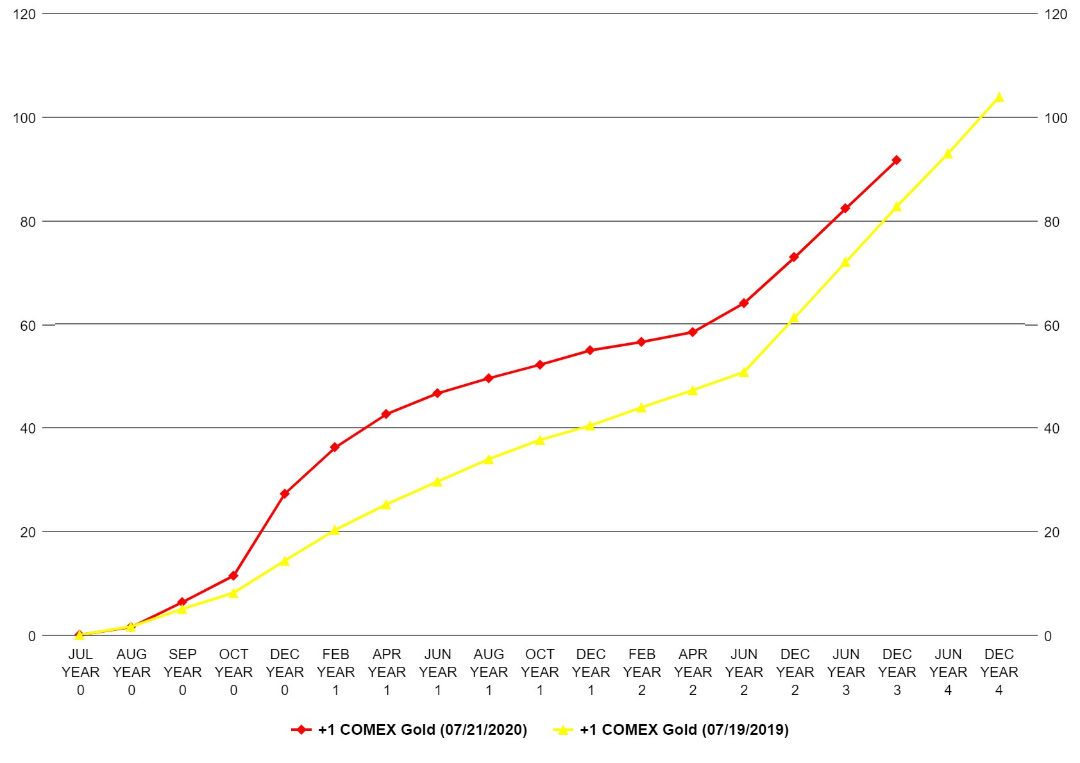
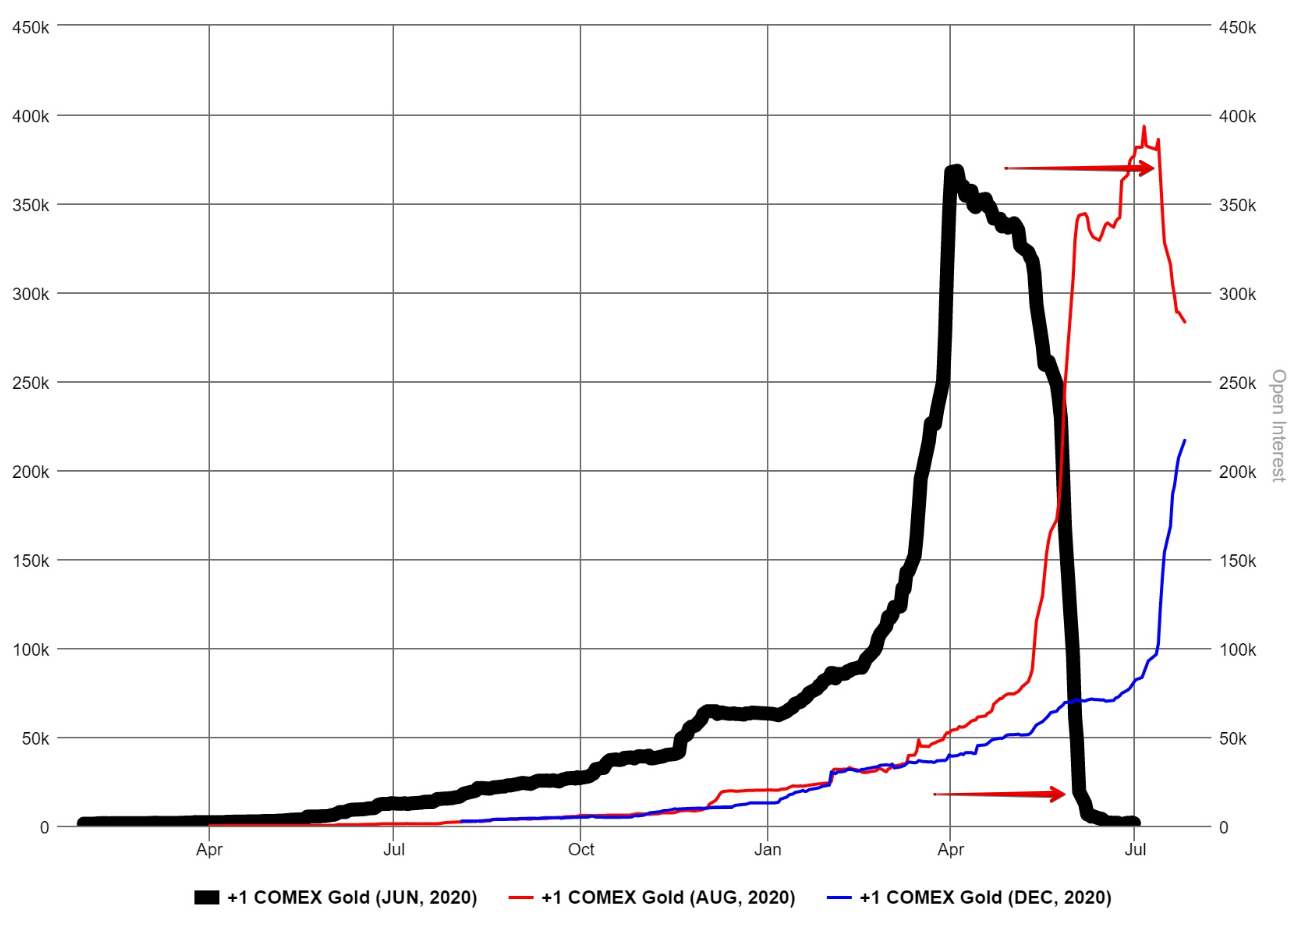
Two additional items we should continue to watch with gold are the large number of short positions currently held by the bullion banks as well as the large spread between the August and December gold contracts. This December contract was $25.7/oz more expensive than the August contract at end of day yesterday, where the five-year average is about $8/oz. Since 2003, the difference between the August and December contracts have not exceeded $12/oz for any length of time. Finally, we believe the concerns regarding the longer-term health of the economy as well as expectations about higher inflation may tend to keep gold above 1800. If this upward momentum continues it may also pressure the bullion banks to attempt to exit their short positions thus maintaining the upwards pressure. But this would most likely only occur should the spread between the spot and futures price start to rise.
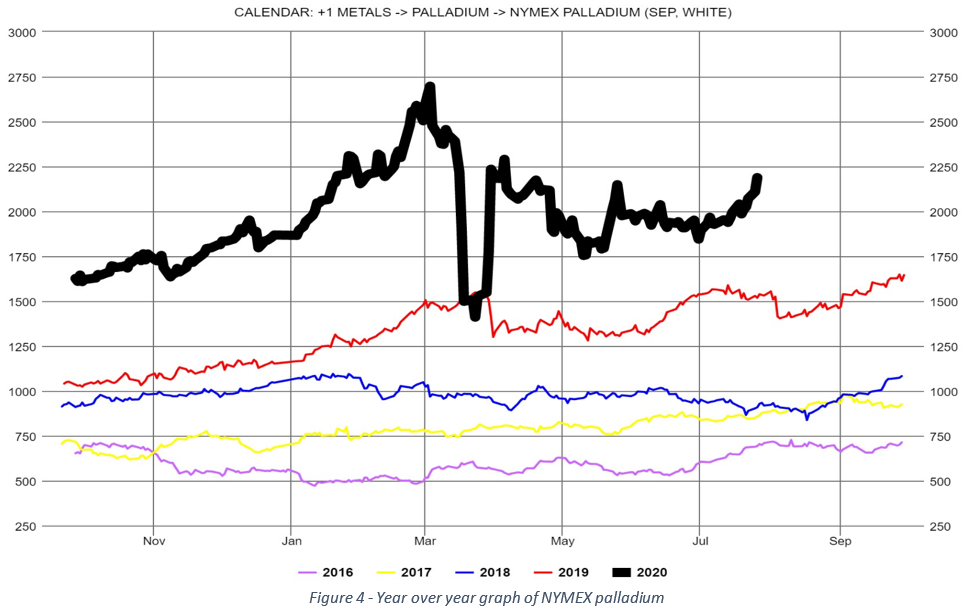
As we have noted over the last few weeks, the total open interest as well as non-commercial net-position of funds have both been increasing for palladium. It should be noted that total open interest continues to build since the lows in late June and the COT report shows net non-commercial positions continue to increase as well. As mentioned last week we will continue to watch this trend to see if there may be early signs of a directional move. Without a clear signal of increasing open interest or news on increased production demand, we expect palladium to continue to trade in a similar pattern for the near future.
These final two charts compare the forward curves from July 21, 2020 and July 19, 2019 and then present the open interest of the June, August and December gold contracts. The significant difference in the shape of the forward curves is what is driving the difference now seen between the August and December gold contract. A similar effect also occurred this year at the end of May as the final roll from June into August was 85% complete. This month, this effect is occurring much earlier and has occurred near the peak of the August open interest as the roll began. Both peaks are identified by red arrows on the second chart. This seems to indicate the pressures to roll to the next contract are rising, compared to previous times.
If you would like access to the great insights and analysis provided by the Fundamental Analytics platform, sign up for a 15-day free trial and demonstration!
If you have any questions, please contact our Technology Manager, Mike Secen at [email protected]
We also invite you to read our other articles and follow us on social media!
Best Regards,
The Fundamental Analytics Team
The information provided here is for general informational purposes only and should not be considered individualized investment advice. All expressions of opinion are subject to change without notice in reaction to shifting market conditions.